What is the Price action in Cryptocurrency Trading?

If you read the article about basic navigation in charts, you know that the chart gives you up to 4 information (open, close, low, high). This 4 information can be very useful in your trading because you can identify very interesting situations on the market, which can help you determine the short-term direction of the price. This method is called Price Action.

First of all, you have to know, that the price on the market is created by the actual bid and ask. So, Price action means, that in the chart you can find certain formations of the bid and ask, which can probably determine the future direction of price.

The Price Action formations are well used in stock trading. So, it can be the good advantage in your trade decisions on the cryptocurrency market. The number of price action formations is large but I think the most efficient way is use formations that have the highest predictive success rate. In this article, I will show you formations verified by us, what we use in our everyday trading.

price action, support, resistance

Support and resistance levels

Support and resistance is the trading concept, which can show you important price levels, where the price can probably react in some way. First of all, it is necessary to realize that the market price is created only by the actual bid and ask. The idea of support and resistance is based on the rejection of bid and ask at certain price levels. It looks like, that the price repeatedly bounces off at certain price levels, which are called Support (for down movements) or Resistance (for up movements).

What does it mean bounce off? There are 3 possible scenarios – price will go up, down or stagnate for some time. You can never determine exactly what happens but you know that probably something is going to happen at this price level. Also, Proven support or resistance is such, where the price will bounce off the line.

Support and resistance price action

Support and Resistance

Explanation of Support and Resistance (S/R)


What is support?

Support means, that the price is bounced off from this price level. The more the price is bounced off from the level, so the support is stronger.

Support price action

Example of Support

What is Resistance?

Resistance means, that the price is bounced off from this price level. The more the price is bounced from the level, so the resistance is stronger.

Resistance price action

Example of Resistance

It is necessary to mention, that proven S/R is such, where the market price will close over for the support line or for the resistance below the line. So, price breaks with highs and lows are allowed. Only close price determine, if S/R is confirmed.

Next important thing is, that the market remembers S/R for some time. For example, if some strong support is broken and when the market returns at some time to that level, it can probably react again. Strong support or resistance means, that price bounced off at least 3x. S/R levels is ideal lfor profit targets or stop loss – you don’t know, what happens there, but you know that something happens.

Trend lines

Trend line helps to determine, where the market probably will move from the long-term view. The market tends to move like a drunk sailor in a harbor. The sailor moves from one side to the other side but the result is, that he goes in one direction.

The Trend is formed through support and resistance lines, which determine the area of a Trend. The Trend can be divided like Up Trend (use of support) and Down Trend (use of resistance). If the price will break S/R line, it can be understood like Trend change.

Up trend price action

UP Trend

Down trend price action

Down Trend

Basically, only 3 situations may be on the market – Up Trend, Down Trend or stagnation. It is good to know, that the beginning or end of the Trend can be recognized when the new candle bar will break through S/R. This break candle should be very big opposite to others bars. Also, It can be understood as a fast locomotive, which in full force will break the barriers (S/R).

Break candle price action

Example of the break candle

Also, some traders use Trend channels in the trend tracking. Trend channel is the area, where the trend is limited support (below) and resistance (top).

SR trend channel price action

S/R Trend channel

Fibonacci retracement

Fibonacci retracement can help you find strong support or resistance levels on the market. Idea of Fibonacci retracement is based on Fibonacci numbers, which are 1,1,2,3,5,8,13,21,34,55,89,144, … The unique characteristic of Fibonacci numbers is that each number is about 1.618 times greater than the previous number.

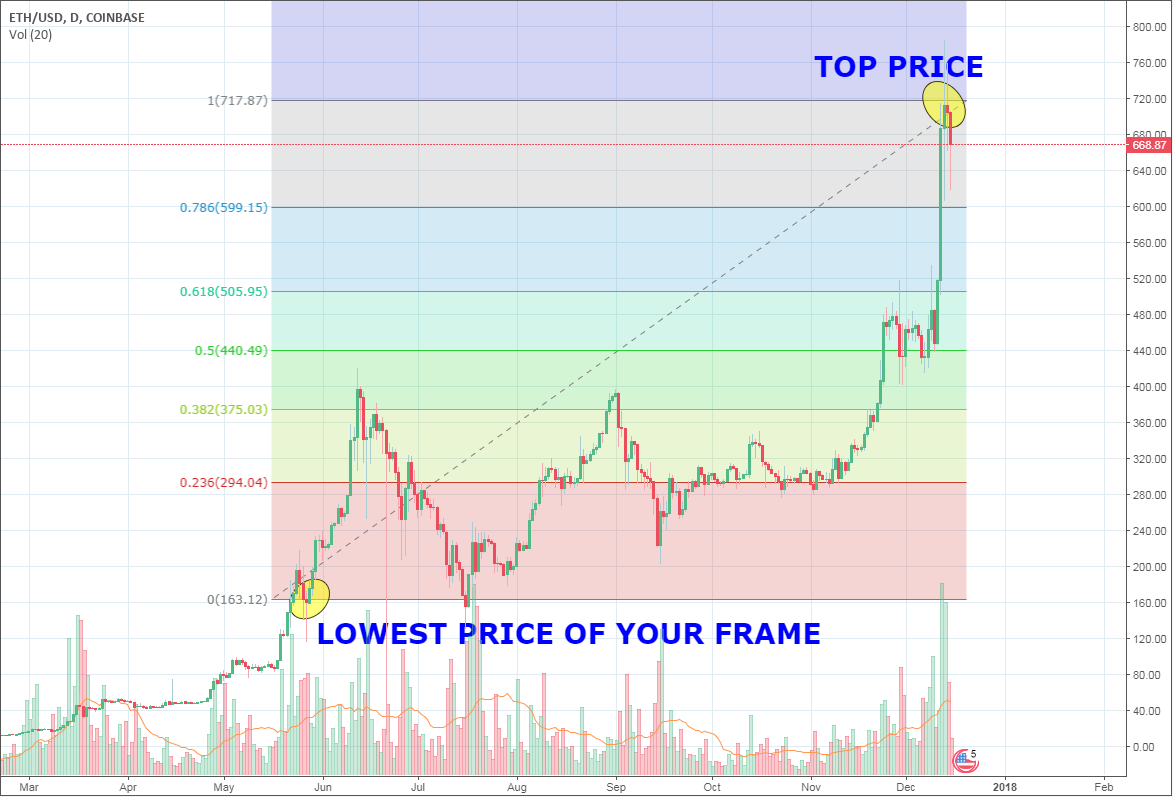
The concept of Fibonacci numbers was successfully transferred into trading industry thanks to the Golden ratio. Fibonacci retracement or levels are created by taking two extreme points on a chart. Usually, it is a top actual price of your time frame and the lowest price of your time frame on the chart. After apply, you will see Fibonacci retracement on the chart.

As a result of use, Fibonacci retracement can very well determine strong supports and resistances. These levels can be very used in your trading for taking profit and etc…

Fibonacci price action

Fibonacci retracement

Usage of price action

Price action can be a good tool in your trading because it can help you with your trading decision. But it is necessary to mention, that trading which is based only on the price action strategies does not make sense. Price action can be only an auxiliary tool in your trading, not the core strategy of your trading.

If you remember, the market price is created by bid and ask of all traders on the market. The ratio of the bid and ask is displayed in the price, which is displayed in the chart. So, basically, chart formations are represent certain situations on the market, which can help you in the short-term trading decision. But if you want to make money and trade long-term, you need something more than an auxiliary tool. In my opinion, the best option for long-term investing in cryptocurrency market is learn main principles of Value investing.