Basic navigation in Charts

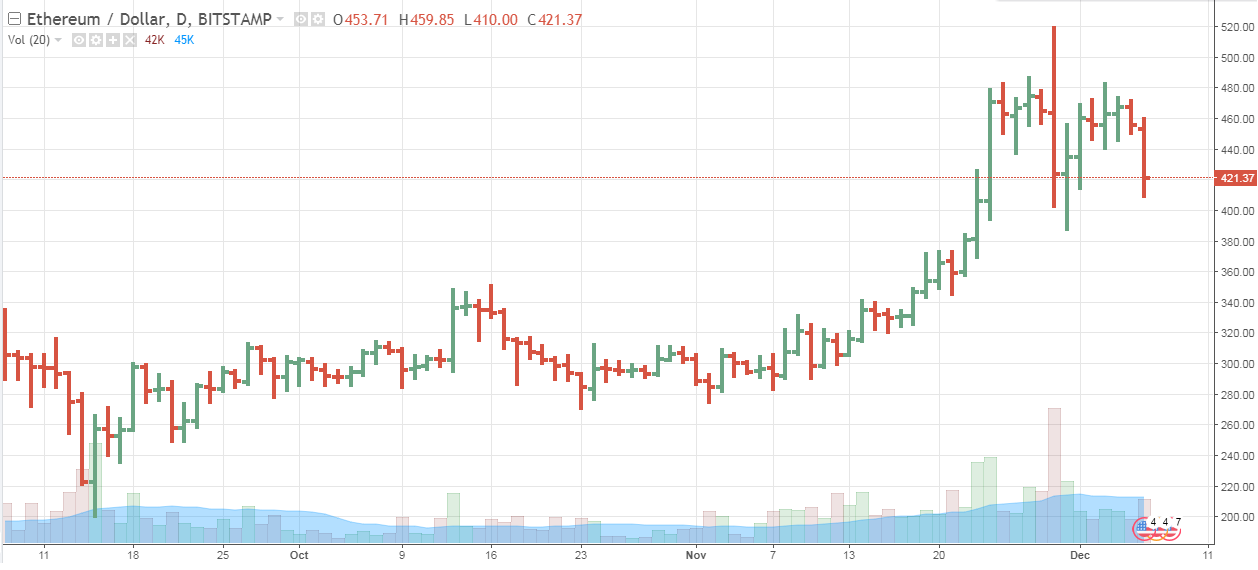
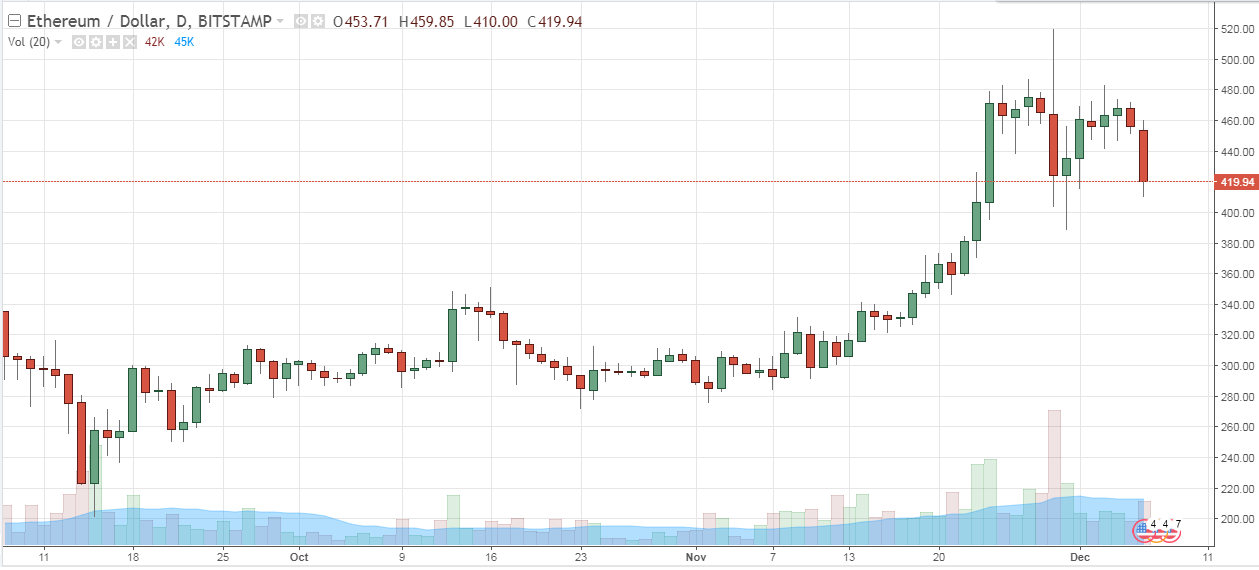
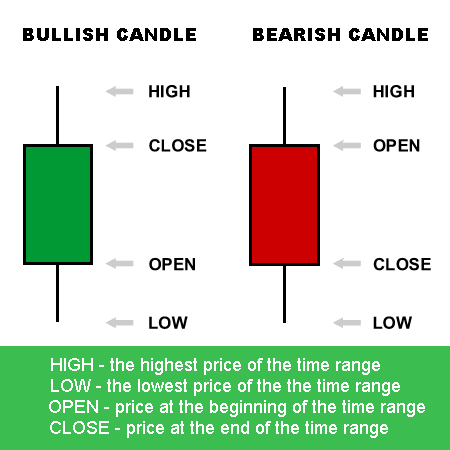
Every trader must have excellent knowledge of orientation in Charts. Maybe you think the graph gives you information just about the actual price, but there is much more information than you think. If you want to be the successful trader, you have work with all available information. First of all, you have to know that we have 3 main types of charts.

Line chart

You probably know the Line chart, because it is the most common type of a graph. The chart represents the close price of an asset. So, the Line chart is a series of closing prices, that is visualized through the Line. The Line chart is good for a long-term view.

Charts

Bar chart

The Bar chart is a much more interesting graph, then a Line chart. The Line chart is providing only one information – about close price. But in the Bar chart, you can see 4 pieces of information – low, high, open and close price. This can be very important in your trading because you can see all prices changes in a chart.

Charts

Candlestick chart

In the Candlestick chart, you can see same information like in the Bar chart (high, low, open, close) but there is a change in visualization. The Bar chart has the wrong visual look because bar on the chart is not so pronounced like Candlestick. The Candlestick bar has a stronger body then a Bar chart so is better recognizable on the chart.

Charts

The conclusion

Others charts are the only combination of these above-mentioned graphs. Most traders use Candlestick type graph not only in everyday trading because it contains all information, what you need and it has a good visualization. Doesn’t matter if you are a day trader or value investor. Thanks to the 4 pieces of information (open, close, high, low) the Candlestick or the Bar chart can be used in price action style. Price action means, that in the Chart are shown exactly Formations, which can determine the future direction of the price.

charts